CrimeRisk™
The highest resolution crime analytics for any address.
TRY ITProbability of a Crime Claim
Risk is everywhere.
Crime rates directly impact risk exposure, insurance rates for commercial and residential properties, and SIU, claims processing, and marketing resources. A top challenge for insurers is mitigating risk and uncertainty in both known and unknown neighborhoods and markets.
Manage it wisely with high-resolution, spatially-accurate crime data.
Since the risk of crime often varies more from address to address within cities than it does between most cities, you can’t afford to risk your budget and company by using inaccurate and broad-brush city-wide, ZIP Code, or census tract numbers. You need to know the risks for the address where your insured is located. And you need the information to be instant, objective, and accurate. Discover how CrimeRisk can dramatically improve your underwriting results today.
- U.S. Crime Data
- Canadian Crime Data
Introducing CrimeRisk™ by Location, Inc.
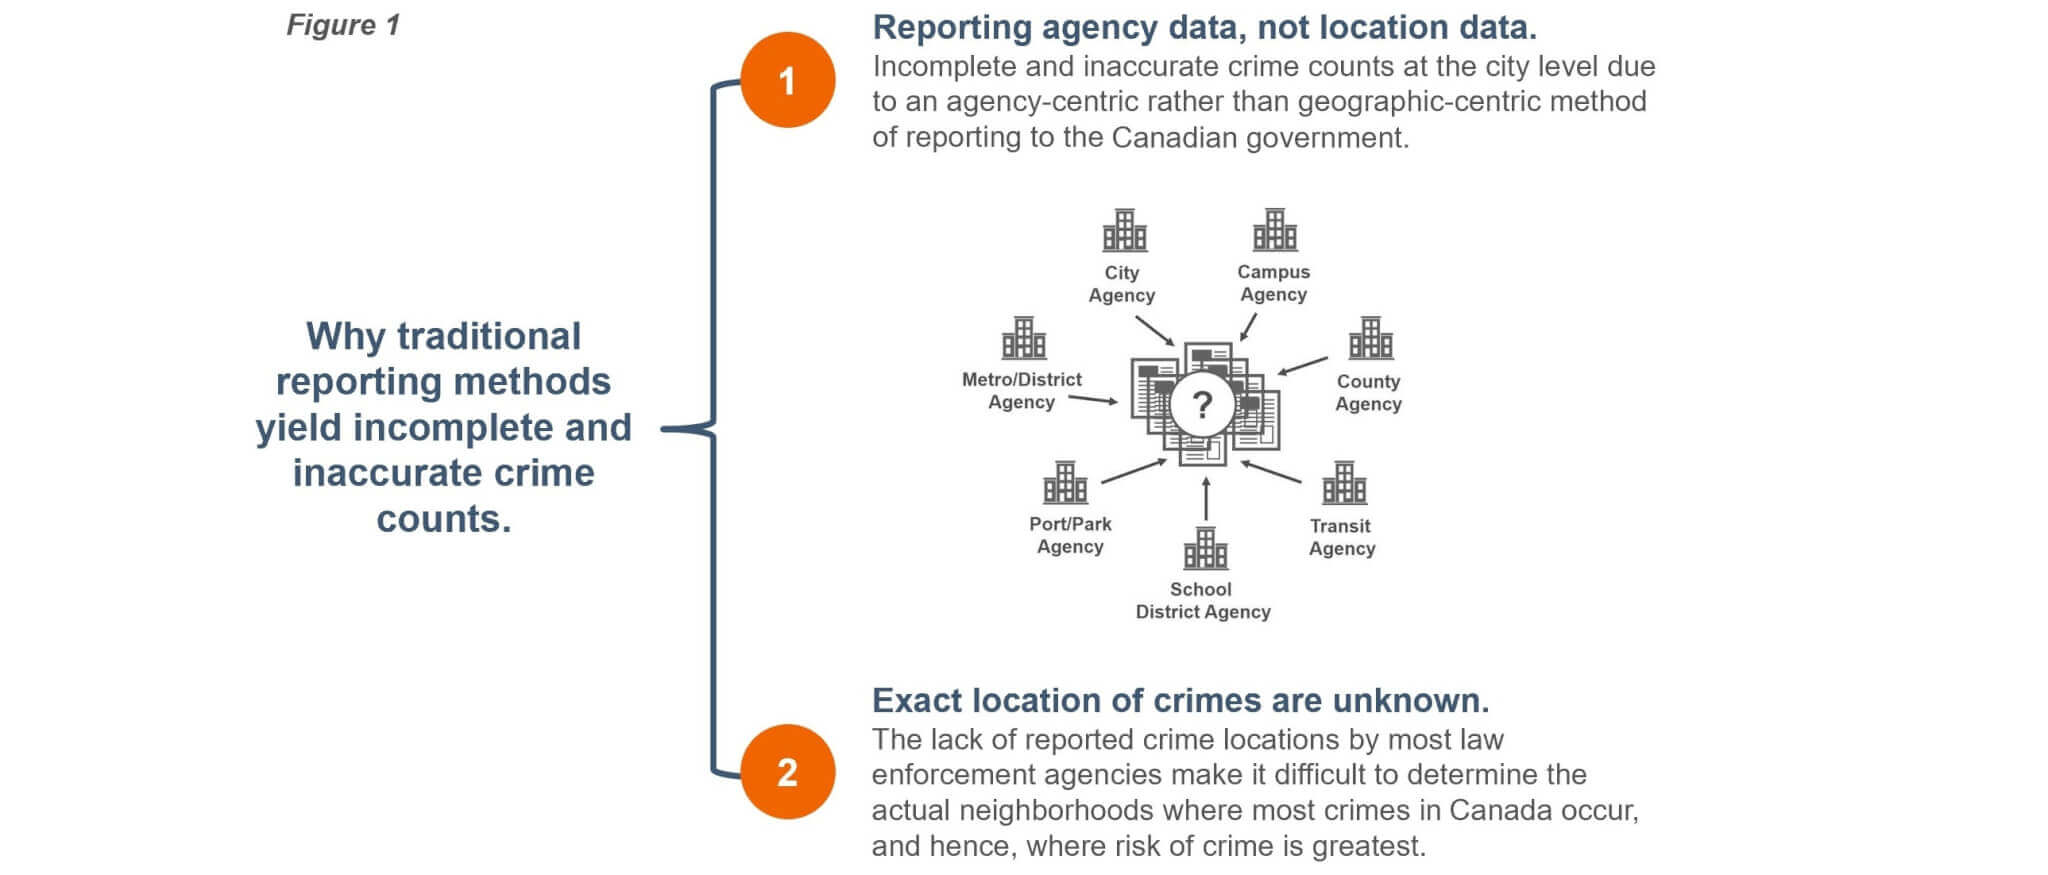
Until now, accurately quantifying the risk of crime for an address has been hindered by two prevailing impediments (Figure 1):
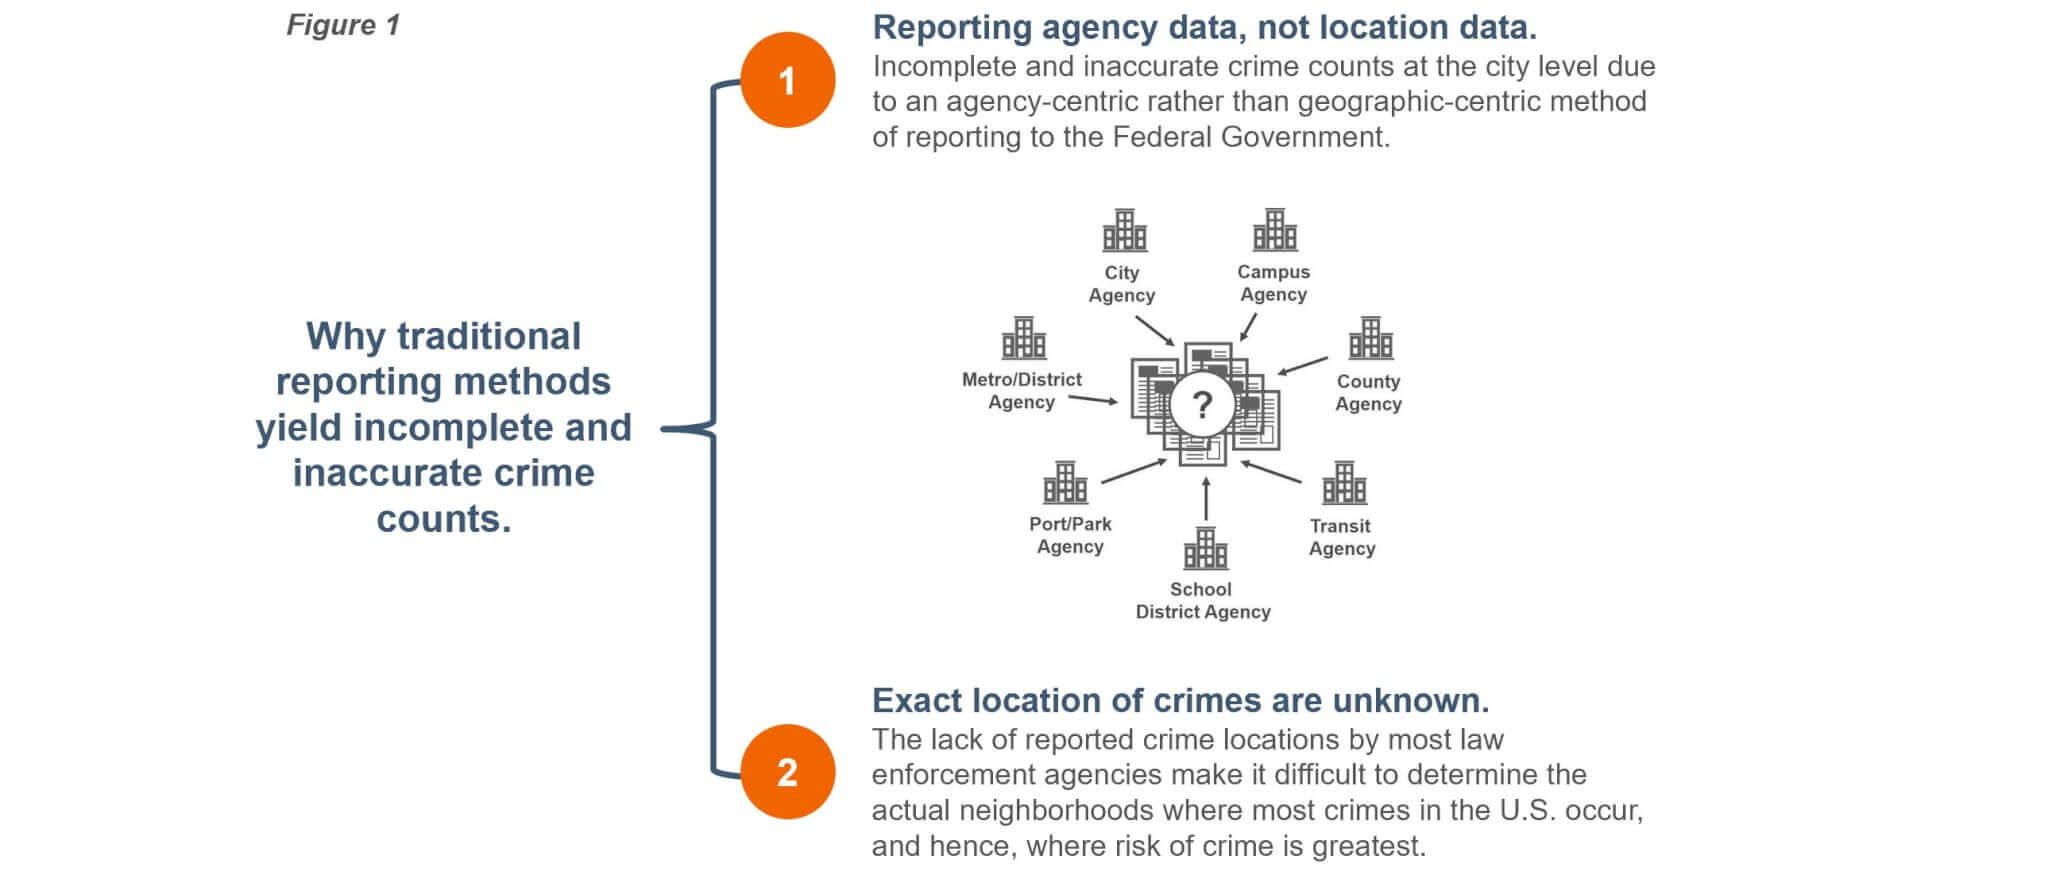
CrimeRisk provides complete and accurate crime counts—at the policy address level.
CrimeRisk by Location, Inc. is a proprietary solution that provides the most spatially-accurate crime data available today—at the policy address level.
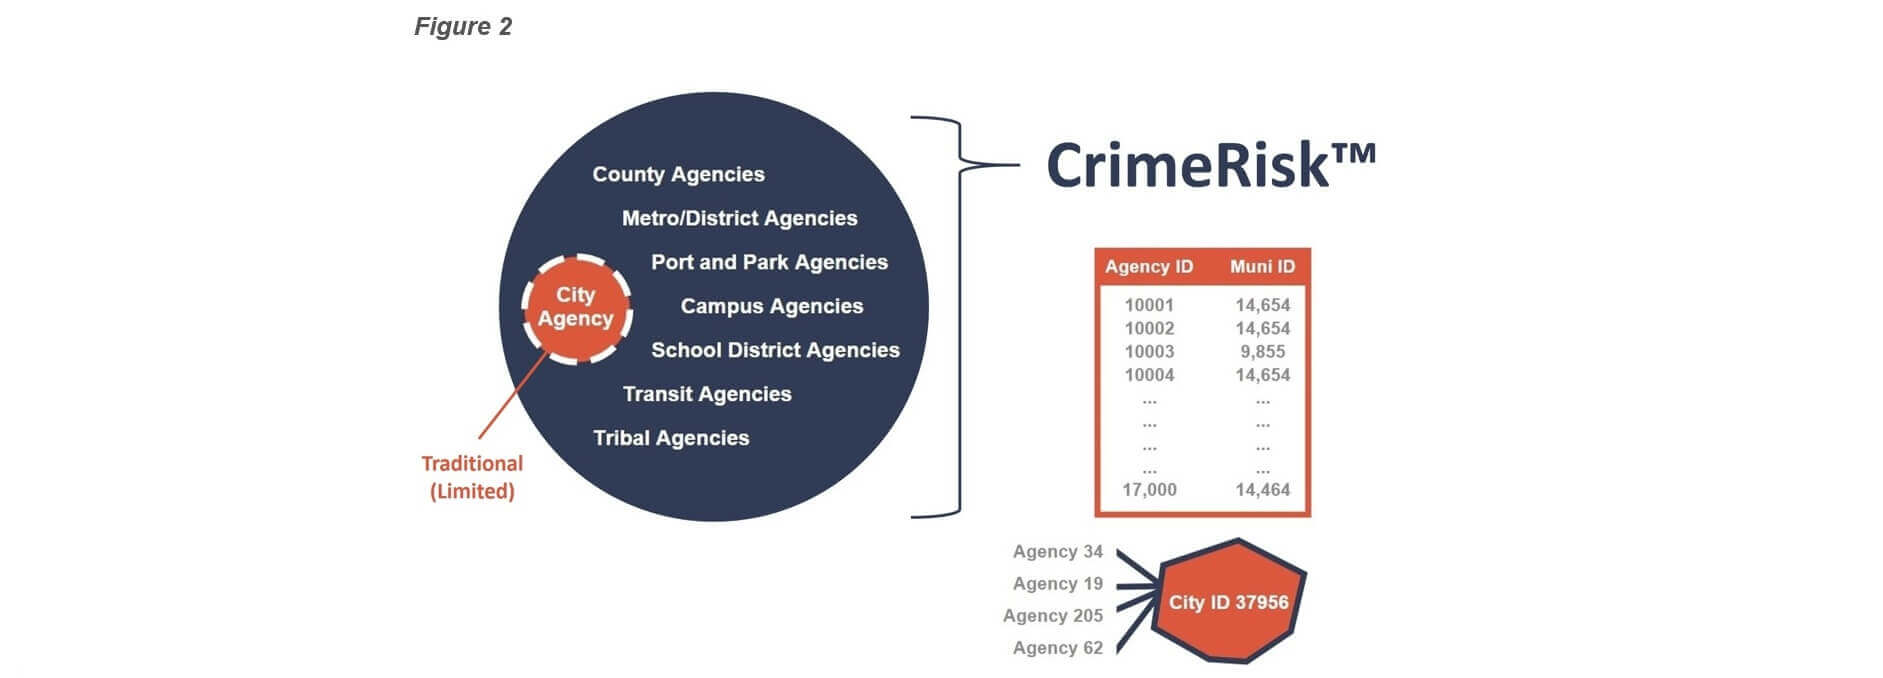
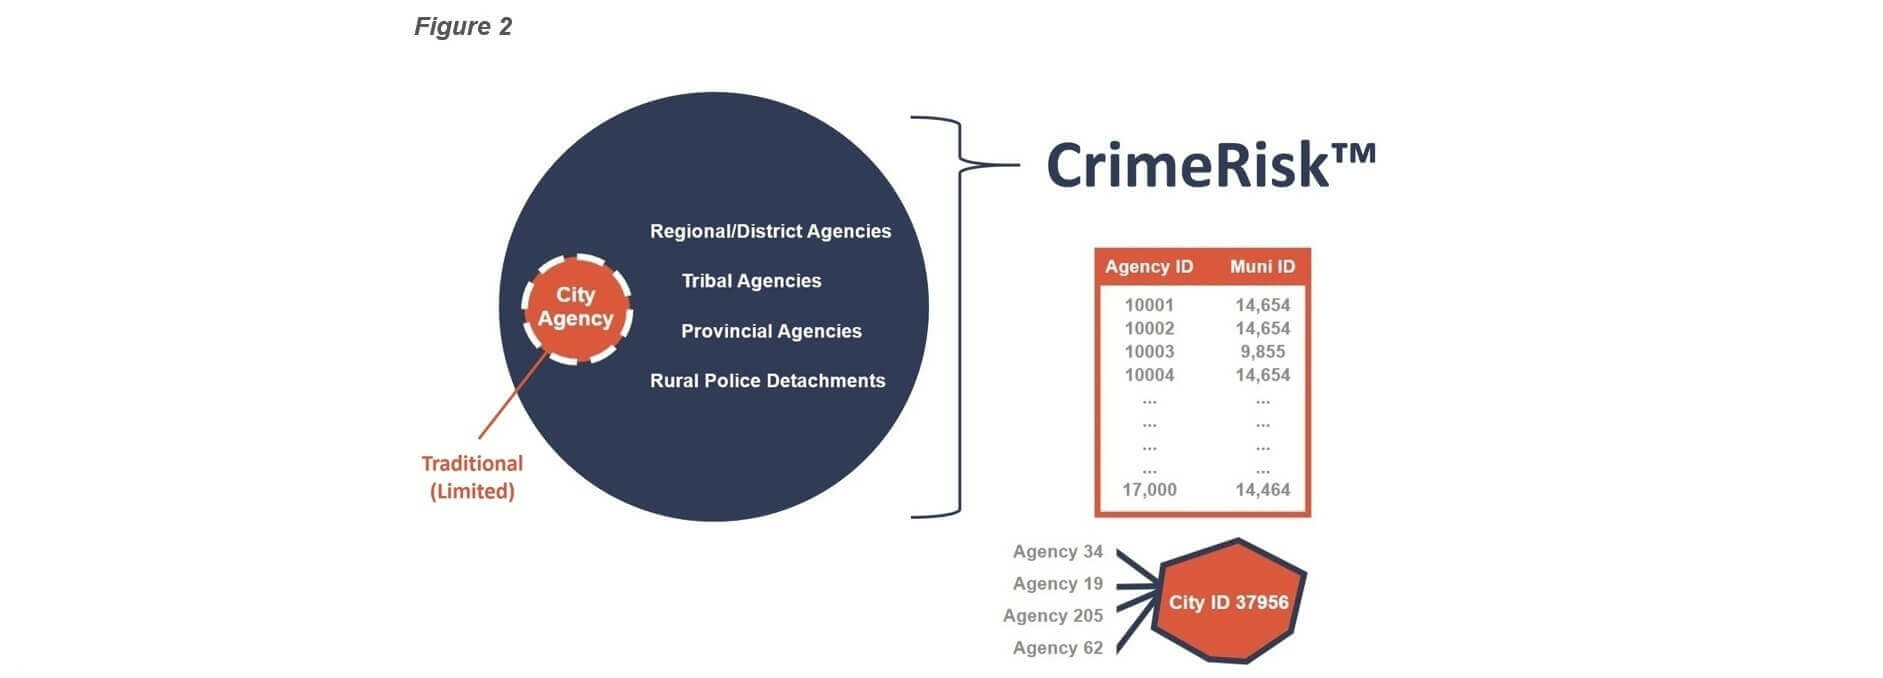
CrimeRisk collects raw crime data from all 18,000 law enforcement agencies in the U.S., and uses a relational database built from the ground up to assign reported crimes from each agency to the city where it has law enforcement responsibility (Figure 2). This method provides an accurate representation of the complete number and types of crimes that are truly known to occur.
After establishing a comprehensive foundation of crime counts, CrimeRisk uses more than 120 proprietary models to statistically predict the rates for every major type of crime for every location in the U.S. Now that the numbers of reported crimes that actually occur in each community are known, CrimeRisk can validate its models against the only comprehensive location-centric crime database in the U.S. with complete national coverage.
How CrimeRisk works
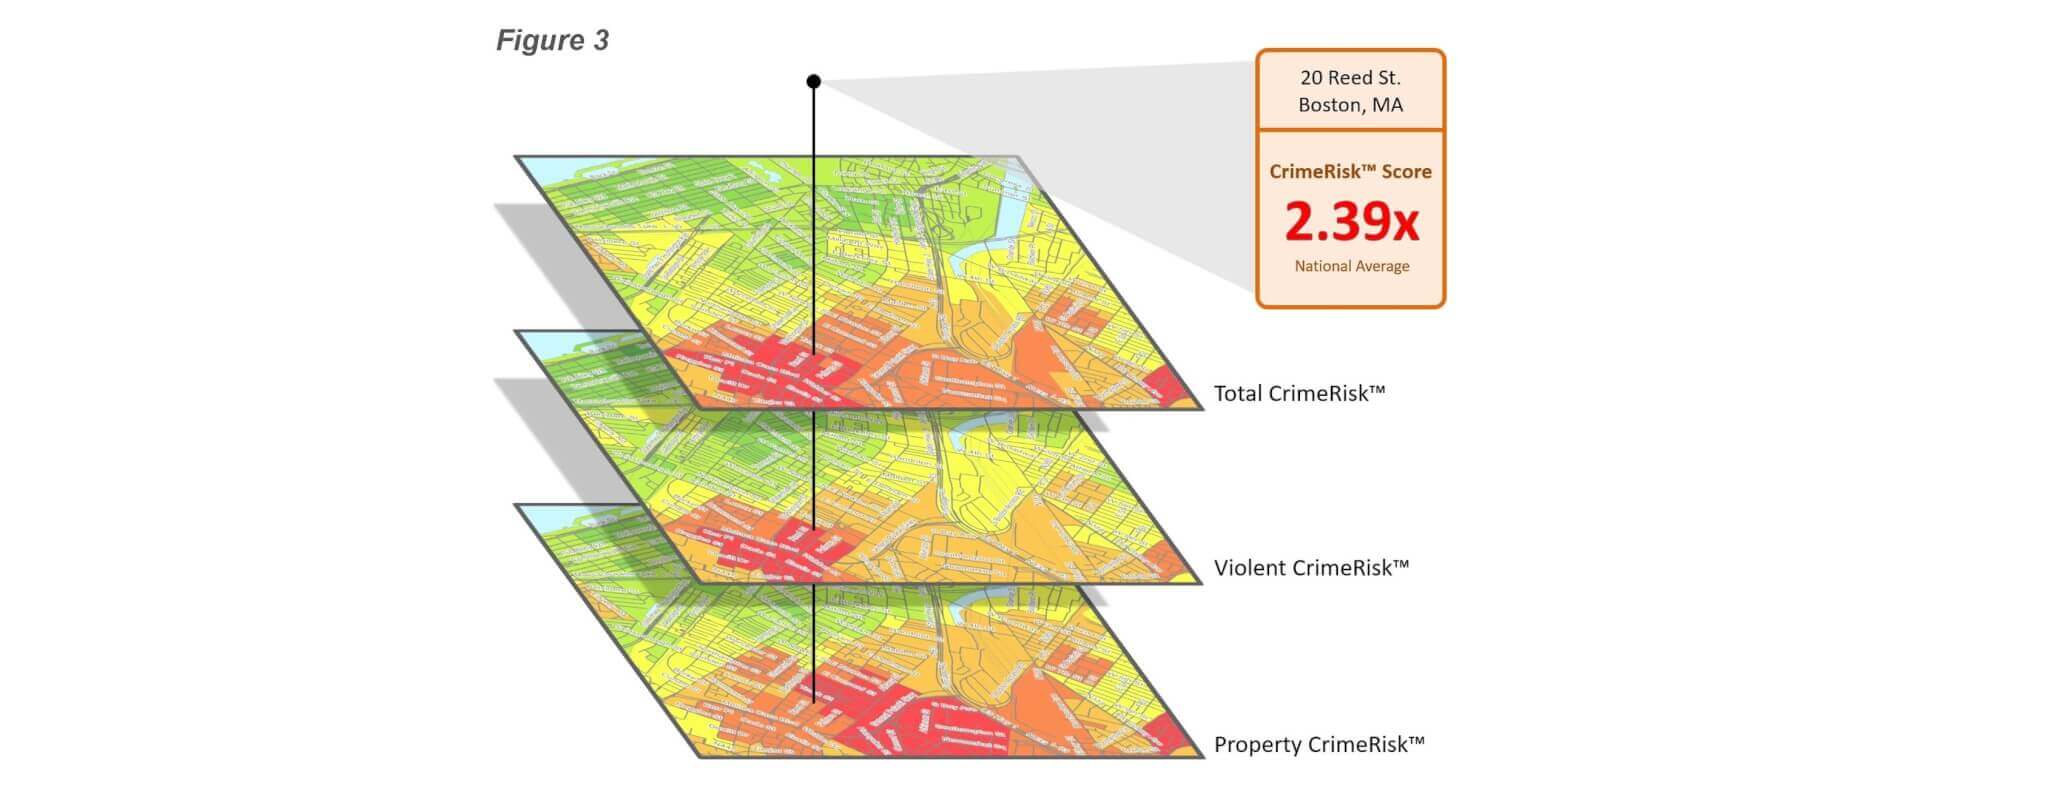
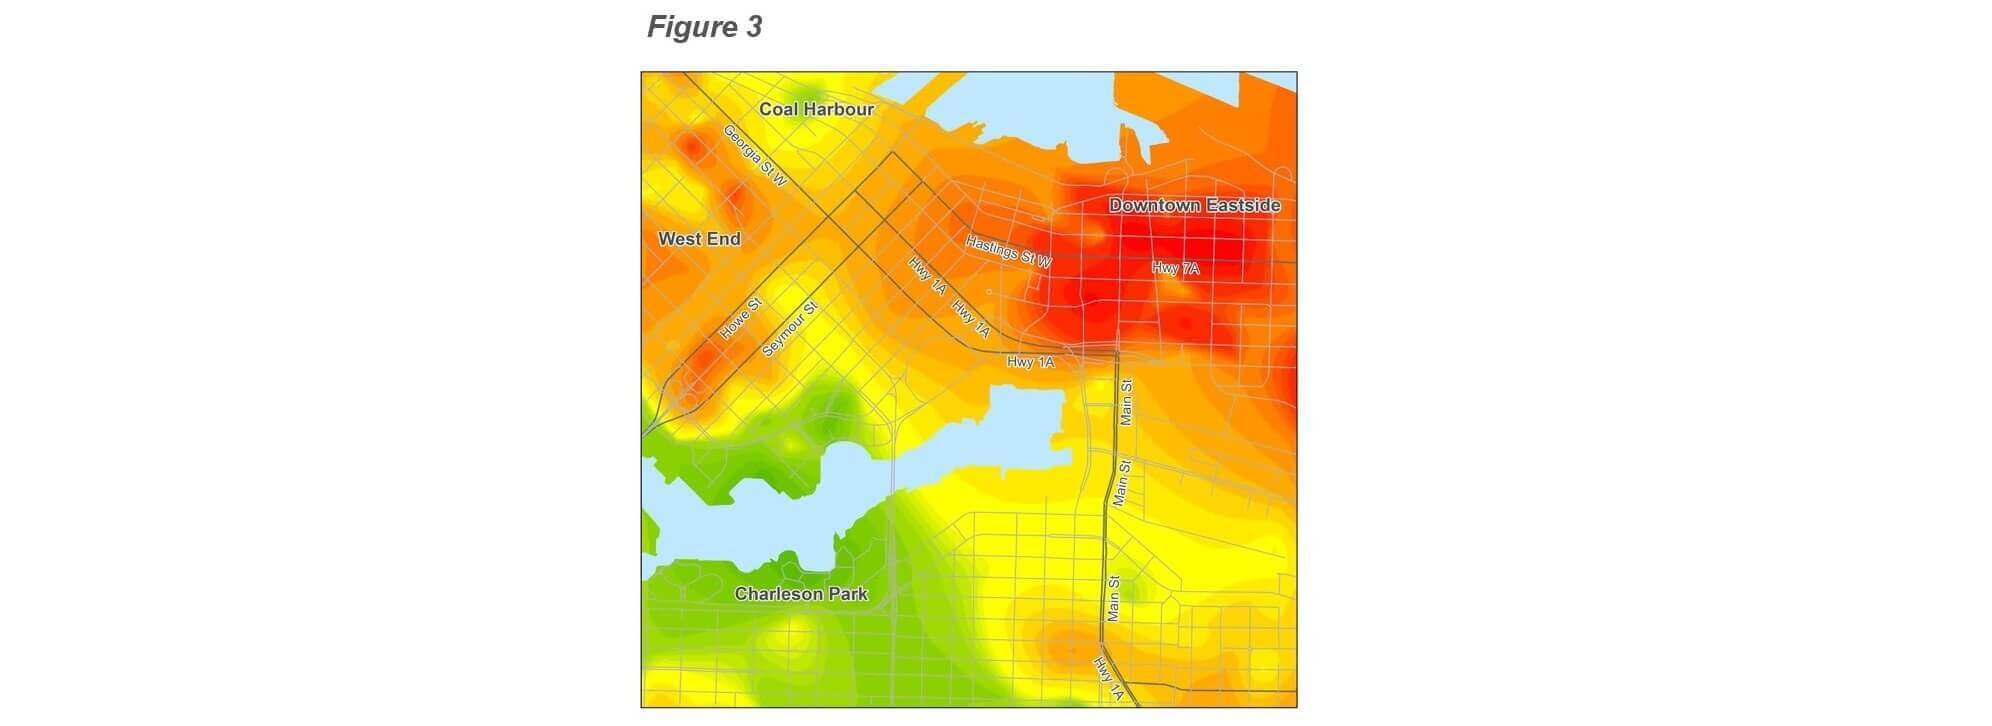
A custom CrimeRisk calculation is generated on demand from these data and is based upon a distance weighted cone of influence around any specified address (Figure 3).
The CrimeRisk calculation is weighted most heavily nearest the address and lessens as it progresses outward, depending on distance and population. This is because risk of crime can be visited on your site not only from the risk at your door, but by risks in your vicinity where threats may emerge. In dense cities, the cone of risk influence on your address is closer to your site, as it should be. In suburban or rural areas, the cone of influence is allowed to extend further outward.
What CrimeRisk can do for you
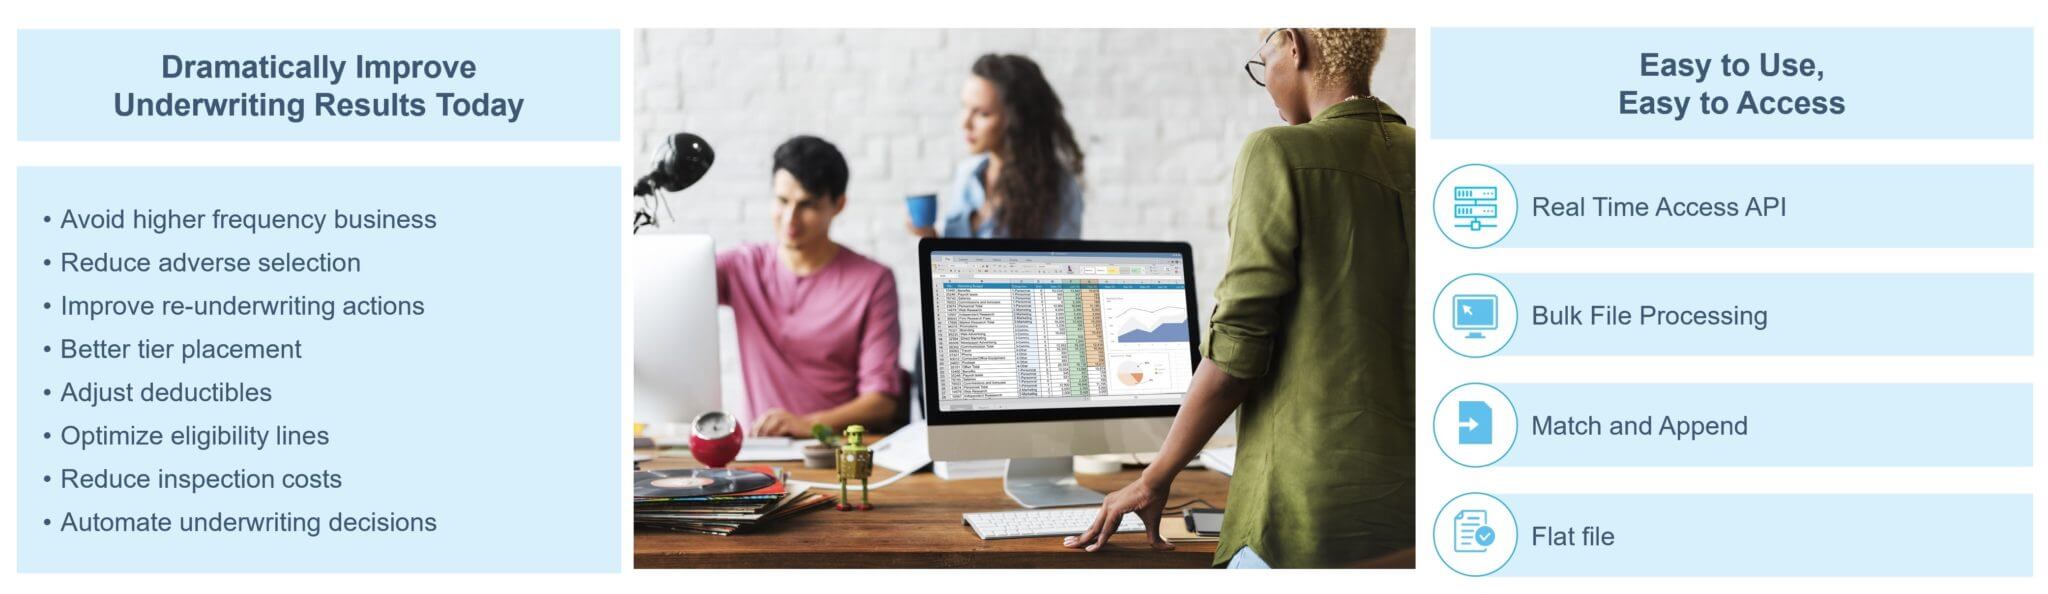
Trusted by insurers to help improve underwriting results (Figure 4), only CrimeRisk provides:
- The highest resolution crime analytics available: 10-meter resolution crime data (48,000X smaller than the average census tract) for the entire U.S.
- 100% seamless national coverage.
- Data validated on more than 8,000 cities nationwide.
- Normalized data with predictive accuracy up to 98%.
- Data for 11 major crime categories (total crime, total violent crime, total property crime, assault, robbery, murder, rape, larceny, burglary, motor vehicle theft, and vandalism).
- 5-year crime forecasts.
- No redlining.
CONTACT US FOR DATA LICENSING OPTIONS
DISCOVER HOW CRIMERISK™ CAN DRAMATICALLY IMPROVE YOUR UNDERWRITING RESULTS
GET STARTED NOWCrimeRisk data contain no red-lining, no data about race, ethnicity, ancestry, language, religion.
Introducing CrimeRisk™ by Location, Inc.
Until now, accurately quantifying the risk of crime for an address has been hindered by two prevailing impediments (Figure 1):
CrimeRisk provides complete and accurate crime counts—at the policy address level.
CrimeRisk by Location, Inc. is a proprietary solution that provides the most spatially-accurate crime data available today—at the policy address level.
CrimeRisk collects raw crime data from all 544 Canadian Police Service Areas, and uses a relational database built from the ground up to assign reported crimes from each agency to the city where it has law enforcement responsibility (Figure 2). This method provides an accurate representation of the complete number and types of crimes that are truly known to occur.
After establishing a comprehensive foundation of crime counts, CrimeRisk uses more than 15 proprietary models to statistically predict the rates for every major type of crime for every location in Canada. Now that the numbers of reported crimes that actually occur in each community are known, CrimeRisk can validate its models against the only comprehensive location-centric crime database in Canada with complete national coverage.
How CrimeRisk works
A custom CrimeRisk calculation is generated on demand from the data and is based upon a distance weighted cone of influence around any specified address (Figure 3).
The CrimeRisk calculation is weighted most heavily nearest the address and lessens as it progresses outward, depending on distance and population. This is because risk of crime can be visited on your site not only from the risk at your door, but by risks in your vicinity where threats may emerge. In dense cities, the cone of risk influence on your address is closer to your site, as it should be. In suburban or rural areas, the cone of influence is allowed to extend further outward.
Put CrimeRisk to work
Trusted by insurers to help improve underwriting results (Figure 4), only CrimeRisk provides:
- The highest resolution crime analytics available, to Dissemination Block level.
- 100% seamless national coverage.
- Data validated on more than 500 cities nationwide.
- Normalized data with predictive accuracy that exceeds 90%.
- Data for 11 major crime categories (total crime, total violent crime, total property crime, assault, robbery, murder, rape, larceny, burglary, motor vehicle theft, and vandalism).
- 5-year crime forecast.
- No redlining.
CONTACT US FOR DATA LICENSING OPTIONS
DISCOVER HOW CRIMERISK™ CAN DRAMATICALLY IMPROVE YOUR UNDERWRITING RESULTS
GET STARTED NOWCrimeRisk data contain no red-lining, no data about race, ethnicity, ancestry, language, religion.